
How to Read a Suburb Scorecard
Data is only useful if you know what it means — and how to weight it for your specific investment goals.
GRIT Property Group
Melbourne · Dubai · New York
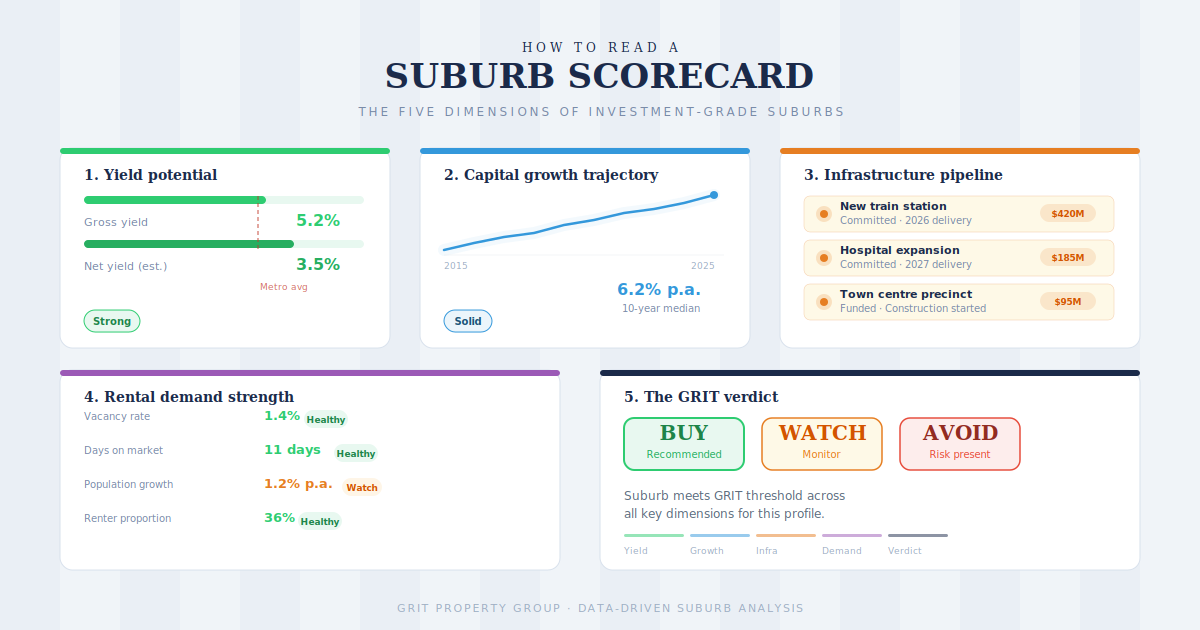
The difference between a good investor and a great one is rarely access to data. It's knowing what to do with it.
Every serious investor eventually develops a framework for evaluating locations. Some call it a checklist. Some call it a gut feel. At GRIT, we call it a scorecard — and we've spent years refining the five dimensions that most reliably predict investment-grade suburb performance.
This guide explains each dimension, how to interpret the data, how to weight the scorecard for your specific goals, and what the red flags look like that disqualify a suburb regardless of how well it scores elsewhere.
📊 Read this alongside a GRIT suburb profile and you'll extract significantly more value from the data.
The five dimensions — explained
Yield potential
What it measures: Current gross rental yield benchmarks in the suburb, compared against the broader metropolitan average and GRIT's internal target threshold.
How to read it: Gross yield is calculated as annual rental income divided by purchase price. A property purchased for $500,000 generating $26,000 per year in rent has a gross yield of 5.2%.
Gross yield tells you the top-line income story. It does not tell you the net yield. A rule of thumb: subtract 1.5–2% from gross yield to estimate net yield in most Australian markets.
| Gross yield | GRIT reading |
|---|---|
| Below 3.5% | Yield is not the story here — the case must be purely capital growth |
| 3.5–5% | Acceptable for Australian markets; assess growth trajectory carefully |
| 5–7% | Strong yield; crosscheck vacancy and demand |
| 7%+ | Exceptional — verify independently; may indicate higher risk or lower quality |
How to weight it: If you're a high-income earner using negative gearing, yield is less important than capital growth and depreciation. If you need the property to be cashflow-positive, yield is the primary filter — don't proceed below your minimum threshold.
Capital growth trajectory
What it measures: The suburb's 10-year median price movement, recent quarterly trends, and GRIT's forward projection based on supply/demand fundamentals.
Capital growth is the engine of long-term wealth in property. A suburb that grows at 6% per year doubles in value every 12 years. A suburb that grows at 3% per year takes 24 years to do the same.
The 10-year median is the most reliable baseline. Short-term movements (1–2 years) can be driven by temporary factors. The 10-year figure smooths these distortions.
| 10-year median growth p.a. | GRIT reading |
|---|---|
| Below 3% | Underperforming — requires a strong specific thesis to proceed |
| 3–5% | In line with long-run inflation; acceptable but not compelling |
| 5–7% | Solid track record; crosscheck for sustainability |
| 7%+ | Strong — verify that recent gains are not distorting the long-run figure |
Forward projection caveat: Past growth does not guarantee future growth. GRIT's projections are based on population growth forecasts, infrastructure spend commitments, and supply pipeline data — not extrapolation of historical prices.
Infrastructure pipeline
What it measures: Committed government spend within a 5km radius — transport, schools, hospitals, employment precincts — and the expected timeline for delivery.
Infrastructure is the single most reliable leading indicator of suburb growth. It drives population movement, which drives rental demand, which drives yields, which drives capital values.
The key word is committed. A proposed project that hasn't received government funding is not infrastructure — it's a concept. GRIT scorecards only count committed projects with allocated funding and published timelines.
| Infrastructure status | GRIT reading |
|---|---|
| No committed projects within 5km | Relying on existing fundamentals — growth depends on broader market |
| 1–2 minor projects | Positive but not a primary growth driver |
| Major committed project | Significant demand driver — flag as a key growth catalyst |
| Multiple major projects | Strong forward thesis — the configuration GRIT actively seeks |
Timing tip: Don't just look at what's being built — look at when it will be completed. Often the best time to buy is before a major project breaks ground, when the market has not yet fully priced in the impact. By the time the ribbon is cut, much of the growth has already occurred.
Rental demand strength
What it measures: Days on market for rentals, current vacancy rate, tenant profile, population growth of the broader corridor, and the depth of the rental pool.
A property is only as good as its ability to generate income. Strong rental demand means low vacancy, fast leasing, pricing power at renewal, and a reduced risk of extended void periods.
| Metric | Healthy | Watch | Red flag |
|---|---|---|---|
| Vacancy rate | Below 2% | 2–3% | Above 3% |
| Days on market (rental) | Under 14 | 14–21 | Over 21 |
| Population growth (corridor) | 1.5%+ p.a. | 0.5–1.5% | Below 0.5% |
| Renter proportion | 30%+ | 20–30% | Below 20% |
Tenant profile matters: A suburb with high renter proportion dominated by students or seasonal workers has structurally different demand than one dominated by working families or professionals. Understand who your tenant will be.
The GRIT verdict
Buy, Watch, or Avoid — with a plain-English explanation of the reasoning. This is the output of all four preceding dimensions, weighted against the investor profile. It is not a hedge. It is a position.
BUY
The suburb meets GRIT's threshold across the majority of dimensions. Fundamentals support an investment decision for the right investor profile.
WATCH
Genuine merit but one or more dimensions require monitoring — supply pipeline, growth trajectory, or vacancy rate. Revisit in 6–12 months.
AVOID
Material risk that outweighs opportunity — structural, cyclical, or valuation-based. One or more dimensions present a disqualifying condition.
Important: A "Buy" verdict is not a recommendation to purchase. It signals that the suburb meets GRIT's criteria for the specified investor profile. Whether that profile matches yours — and whether the specific property represents value — requires personalised advice.
How to weight the scorecard for your strategy
Not every dimension matters equally for every investor.
| Your goal | Primary | Secondary | Least critical |
|---|---|---|---|
| Long-term capital growth | Capital growth | Infrastructure | Yield potential |
| Cash-neutral / cashflow-positive | Yield potential | Rental demand | Capital growth |
| Negative gearing + long-term hold | Capital growth | Yield (floor only) | Infrastructure |
| SMSF / retirement income | Yield potential | Rental demand | Capital growth |
| First property, conservative | Rental demand | Capital growth | Infrastructure |
Red flags that disqualify a suburb — regardless of score
Some conditions are disqualifying on their own.
Vacancy rate above 4%
Indicates structural oversupply or weak demand. The risk of extended void periods outweighs the opportunity regardless of yield or growth history.
Large supply pipeline relative to population
If new dwelling approvals represent more than 2–3% of existing stock per year, supply is likely to exceed demand and compress both yields and capital values.
Single-industry employment dependence
A suburb where the majority of the rental pool is employed in a single industry (mining, government, tourism) is exposed to structural demand shocks. Diversified employment is a prerequisite.
Developer-driven price inflation
Where new property is consistently sold at a premium to established comparables — and rarely achieves that price at resale. If the primary sales channel is developer marketing, approach with caution.
Declining population corridor
Population growth drives rental demand. A suburb experiencing population decline faces structural headwinds that no yield or growth history can offset.
Using a scorecard alongside a finance pre-approval
A scorecard tells you whether a suburb is investment-grade. Your finance pre-approval tells you what you can afford. The overlap between the two is where your shortlist lives.
Identify 3–5 suburbs that score positively on the GRIT scorecard and fall within your price range.
Within each suburb, identify 2–3 specific properties using comparable sales data and your property manager's rental appraisal.
Run the cashflow model for each property at your pre-approved borrowing rate, accounting for vacancy buffer and tax position.
The property that combines the strongest scorecard suburb with the most defensible cashflow model is your purchase recommendation.
Want GRIT to run this process for you?
A Strategy Session is 60 minutes with an Investment Strategist who will identify the right suburb, the right property type, and the right structure for your situation — and present a written strategy before you leave the room.
Book Free Discovery Session →"The truth will set you free."
GRIT Property Group │ Melbourne · Dubai · New York